Data Transformations
Extract multiple values
When working with Akvo Flow data, as well as other external datasets, you may come across columns that hold more than one value in one cell. This kind of multiple value columns are impossible to analyse, unless you extract individual values from them first. One way to handle them is to split the values into multiple columns.
Sometimes you are only interested in only one or two values from the entire string. A great example of this case, is water quality data which you can capture as part of your Flow dataset. This data, depending on the test type, can contain one or more result values and even an image. In your analysis you might just need to work with one result value.
To handle multiple value columns we created a transformation type called Extract multiple values. This transformation helps you extract individual values for columns holding answers to the Akvo Caddisfly question type and Geoshape question type in Akvo Flow datasets.
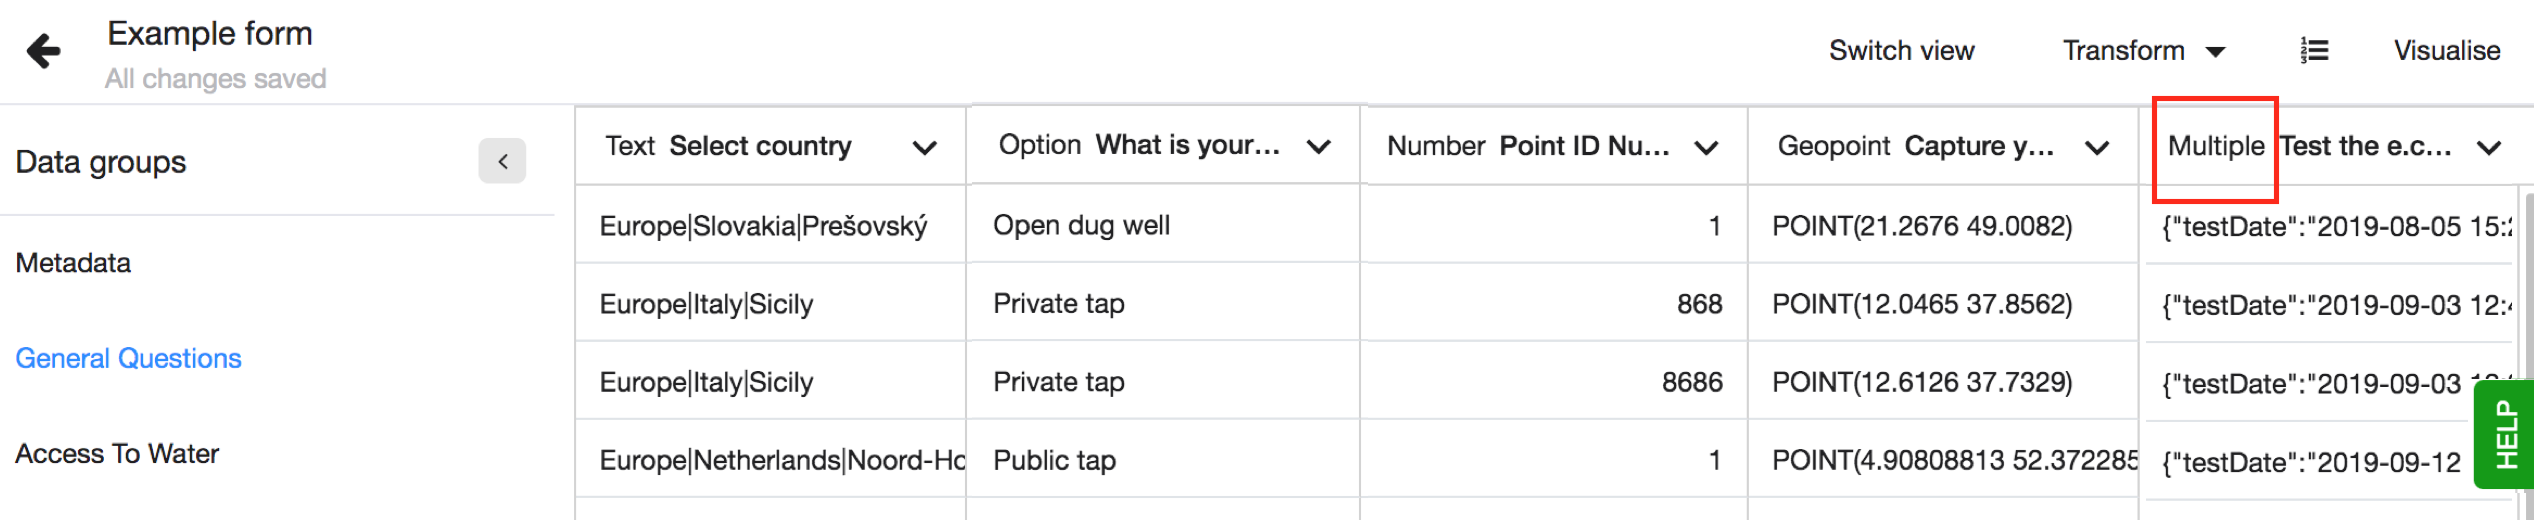
Data type - Multiple
Extract multiple values is a transformation type you can use to work with your Akvo Caddisfly water quality data and geoshape data that hold details of the share as area size, length and number of points used to create the shape. After you have imported your Flow dataset, you will see that your columns have the data type - MULTIPLE.
Extracting multiple values
Extracting multiple values means getting individual values out of the original column and into a separate column. This transformation option can be used with columns that have the data type - multiple.
To extract the data you need follow these steps:
- Go to Transformations and select Extract multiple values.
- In the dropdown select which column you want to work with. Please note that only columns with the data type - multiple, will show in this list.
- Now you see a list of values you can extract.
- Select the one you want to have in a separate columns, or all.
- For each selected value you can define the new column name to make it easy to work with the columns in your further transformations or in visualisations.
- Hit Extract once you are ready.
Please note that all new extracted data columns will have the data type set by default to - text. You can always change the data type follow the steps listed here.
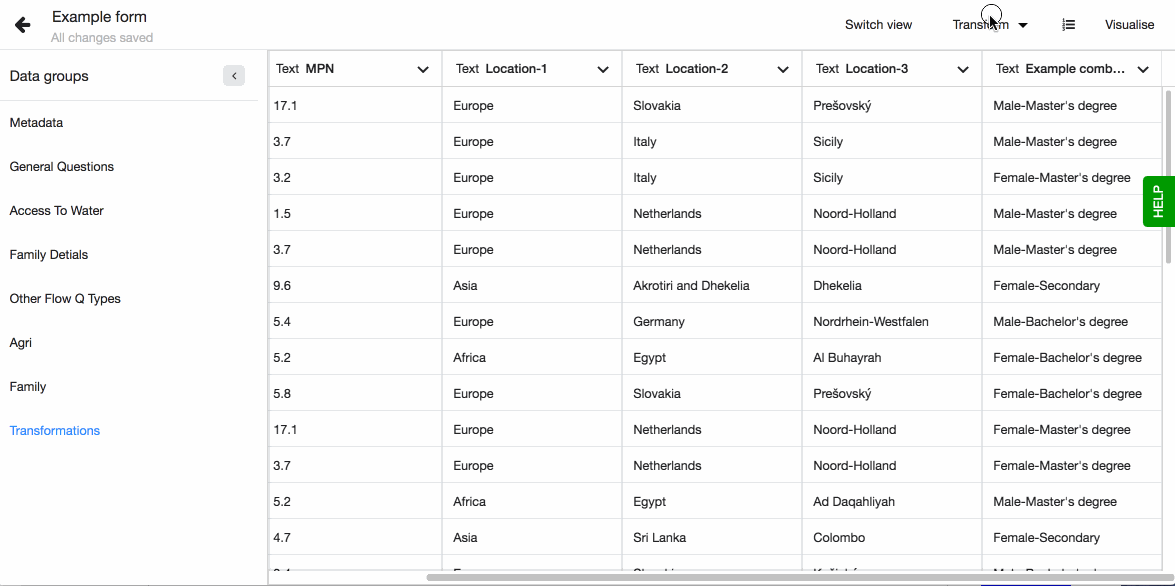
Split column values
When working with Akvo Flow data, as well as other external datasets, you may come across columns that hold more than one value in one cell. This kind of multiple value columns are impossible to analyse, unless you extract individual values from them first.
A great example of this type of data are Flow's cascade questions, where your data holds usually three values or more values separated by a '|', or options where you have the code and option name defined split by a ':'. In both cases you want to have the individual values in their own columns.
Splitting columns
Splitting columns means getting individual values out of the original column and into a separate columns. This transformation option can be used with columns that have the data type - TEXT.
To split the data you need follow these steps:
- Go to Transformations and select Split column values.
- In the dropdown select which column you want to work with. Please note that only columns with the data type - text, will show in this list.
- Now you need to set the character (or string of character) based on which the data will be split to multiple columns. Lumen will suggest some possible separators based on the data in the selected column.
- Define prefix name for the new columns. This will become the name of the new columns together with an order number. If your original column will be split to three new ones and you set the prefix to be 'Location', then the three column names will be 'Location-1'; 'Location-2' and 'Location-3.
- Hit Extract once you are ready.
Please note that all new data columns will have the data type set by default to - TEXT. You can always change the data type follow the steps listed here.
Combine columns
For the purpose of data analysis, it can be useful to combine two columns into one. For instance, if "First Name" and "Surname" are shown in two different columns, it might be necessary to have these in the same column to identify someone.
To combine the columns, go to ‘Dataset Editor’ and pick ‘Combine columns’ from the list of available transformations. Choose the columns that need to be combined together. These columns will not be changed by the process, but instead will create an entirely new column.
Next, you will need to select a separator. It is currently possible to separate column values by whitespace, comma or have no separator at all. Separator sets a rule as to how two combined values appear together in one column.
Give the new column a title and press ‘Combine’, and the new column will appear as the last column of the dataset.
Transformation Log
Transformation log shows a list of transformations that were applied to the dataset. It makes all the changes that the dataset went through open and transparent. It is possible to undo the last changes by clicking the Undo button.
Derive Category column
You just created a new visualisation and realised that there are too many variables making the visualisation hard to read. For example, when testing water quality the result numbers can vary but often ranges of these results are enough to indicate if the water is safe or not. Or another example would be the different crops farmers plant. Out of the 10 different crops answered only 4 are most used and the other 6 can be grouped into one category called Other (with the answers in brackets).
You want to simplify the visualisation to better convey the insights you have gained from the analysis while not loosing any of your data. In this case you can derive a new column that groups your data into categories using Lumen's Derive column - Category column transformation.
Creating a new Category column
This transformation enables you to create a new column based on the data from the selected column. You create categories for the original unique values. A new category can be derived from one unique value, or from multiple values (ranges of numbers, for example). You can use TEXT and NUMBER data types with this transformation.
Working with TEXT data
To create a new Category column from TEXT columns follow these steps:
- Go to Transformations and select Derived column, then Category column.
- Select the column you want to base the new column on. You can type a keyword to find the column or search for it in the dropdown.
- Now you see all the unique values from this column on the left. These are organised by count (number of times they appear in the dataset). You can sort them alphabetically if you prefer.
- On the right hand side you can create the Category column. Give it a name.
- On the right hand side you create the new categories. A category can be based on one unique value, or on multiple by creating a group.
- To create a group, hover over the unique value you want to start with and select the other unique values you want to add. You can search for a specific keyword or select all.
- All unique values that are not assigned a category will automatically fall under the category, Uncategorized.
- Once ready, Derive the new column. Your new column will appear as the last column in your dataset. It will be by default set to the data type TEXT.
- Once you update your dataset with new data, the categories will automatically apply on the new rows. If the new rows hold a value that has not been categorised, it will automatically be given the value, Uncategorized.
Working with NUMBER data
To create a new Category column from TEXT columns follow these steps:
- Go to Transformations and select Derived column, then Category column.
- Select the column you want to base the new column on. You can type a keyword to find the column or search for it in the dropdown.
- Now you see the number of unique values, the minimum and maximum value. This information is to best help you when working with number data.
- On the right hand side you can create the Category column. Give it a name.
- On the right hand side you create the new categories. A category can be based on one unique value, or on multiple by defining the condition based on which the values will be handled.
- In the left column, click on 'Define new category'.
- Define the condition that you want to trigger the rule. Set the number to complete the condition.
- All unique values that are not assigned a category will automatically fall under the category, Uncategorized.
- Once ready, Derive the new column. Your new column will appear as the last column in your dataset. It will be by default set to the data type TEXT.
- Once you update your dataset with new data, the categories will automatically apply on the new rows. If the new rows hold a value that has not been categorised, it will automatically be given the value, Uncategorized.
When to use this transformation?
Here are a few examples on how you can make the most of this Lumen transformation.
Group less occurring values Have you created a visualisation which has a few values that have occur most in your dataset but many values that appear an insignificant number of times? This may result in your visualisation to look chaotic and hard to read. In this case you can create a new Category column to group the less selected values into one category to simplify your visualisations. Create new categories for the top values, you can use the same value and create one group with all the other values.
Group similar values
When designing a survey you often aim to provide as many options as possible to the respondents to pick from. However, when analysing the data you then realise that some options are similar and can be grouped to simplify your visualisations, for example vegetables can grouped based on their types into leafy green, root, legumes, etc or water quality e.Coli health risk categories can be grouped into less detailed options, as high risk, medium risk, safe. With the Category column transformation, as in the example above, you can group the unique values into a shorter list of categories to simplify your visualisations.
Create ranges
Water quality measurements have been done and the map should have dots marked with a range: green=safe, yellow=border case, orange=unsafe. The data comes as a number from 1-50 (safe), 51-200 (border case), 200-more (unsafe). In this case or any other numerical data case, you can use this transformation to define the ranges that better convey the insights you need.
Assign points to values
Often when calculating indicators or a score the first step is assigning points to the values answered in the dataset and then running the calculation on those scores. You can assign these point directly in your Flow survey to your options using the option codes or you can use the Category column to derive a new column with the points.
Clean text column
Do you have a column where values are the same but spelled differently, for example UNICEF, Unicef, unicef. In your visualisation these will show as separate unique values, despite them representing the same thing. You can use the Category column transformation to create one group out of all these alternatives thus to ensure your data is simpler and consistent.
De-identify data
Your dataset often holds personal details, but when visualising and sharing the data you do not want to share the personal details of the subjects of your data collection. With the Category derive column you can group individuals or create a separate column with IDs instead of people's names. For example, my dataset is about farmers and their yield. I do not want to share the farmers names in the pop up on my map where I show their plots with their average yield and crop type. So I derive a new Category column where I assign each farmer a unique ID. This way I can still trace back in the dataset which farmer is which, while being able to share the map and other information openly.
Derived Column JavaScript Basics
Sometimes, information available in the dataset is not sufficient to help you answer your questions and support your decision-making. For instance, you may have data on respondent’s income and the number of children in the household, but no reliable way to judge whether your respondents’ income is enough to provide for the family members.
Another case might be that you want to monitor the quality or progress of the data being collected. With several data collectors working in the project region, you would like to check how many survey questions, on average, data collectors fill in. However, this kind of information is not readily available in the dataset.
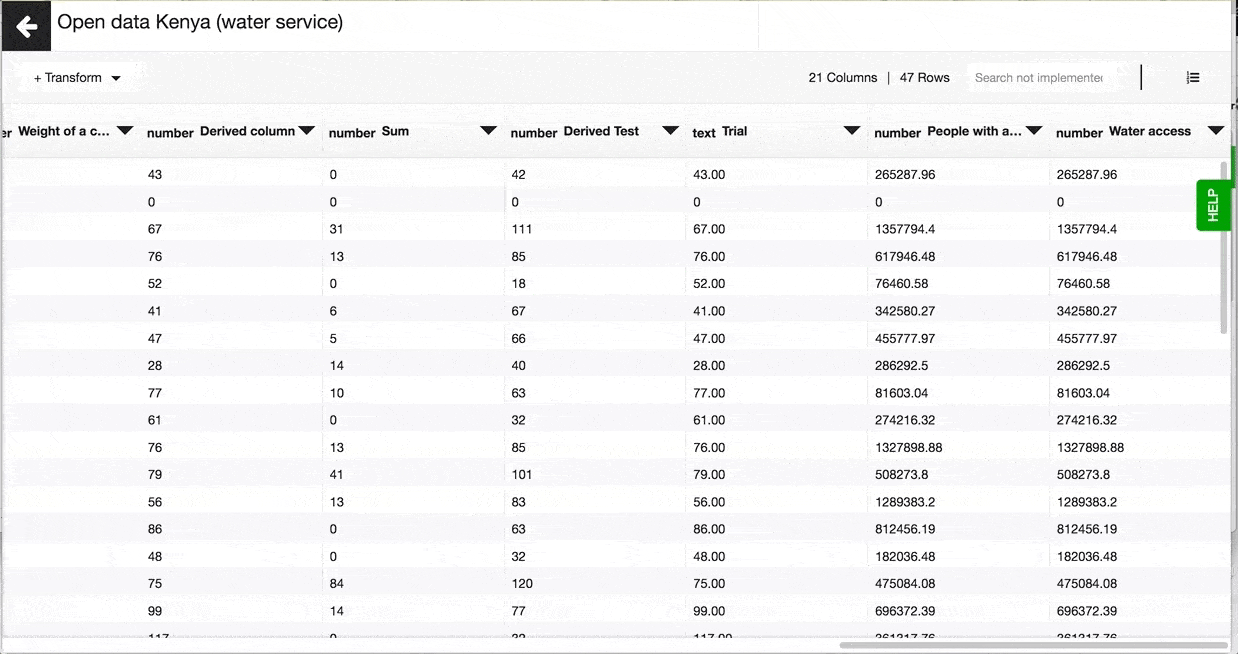
Dilemmas like the above examples can easily be solved in Lumen by using the derived column functionality. A derived column allows you to compute a new column based on information already in the dataset.
At the core of the functionality is setting a rule or a set of rules using a Javascript expression.
A Javascript expression in Lumen is made up of variables (selected columns from your dataset), operators ( +, -, /, * etc) and/or Javascript functions. A Javacript expression will return computed values in a new column, which will appear as the very last column in your dataset.
An example of Javascript expression would look like this:
(row['population_in_the_county'] * row['water_coverage_in_percentage']/100)
Want to dive deep into computing derived columns using Javascript expressions?
We wrote this Derived Column Cookbook with practical examples for you to get started.
If you need some assistance or have a question about the derived column functionality, please get in touch with your contact person at Akvo or fill in our support form.
Derived Column JavaScript Cookbook
If you're making your first steps with the derived column functionality, why not check out our Derived Column Cookbook?
In this curated collection of Javascript expressions (we also call them 'recipes'), you'll find out how to split columns, calculate frequency and other useful practical examples.
Do you have an idea of a 'recipe' you think could be useful to other Akvo Lumen users? Please let us know and we'll be happy to add them to the Derived Column Cookbook.
Derived Column JavaScript: Extract a month from a date
What’s the problem?
Flow surveys show submission dates (2018-11-28T15:39:19+01:00) however, individual dates might be too granular to analyse changes over time. This is why it might be handy to generate a month from a date. You need to use a derived column to do it.
How to solve it?
Make sure your submission date column in of a date data type. Select 'Derive column' under the transformation options. Use the following expression to generate a new column (if the submission date column name is Submitted at):
["January", "February", "March", "April", "May", "June", "July", "August", "September", "October", "November", "December"][new Date(Number(row['Submitted at'])).getMonth()]
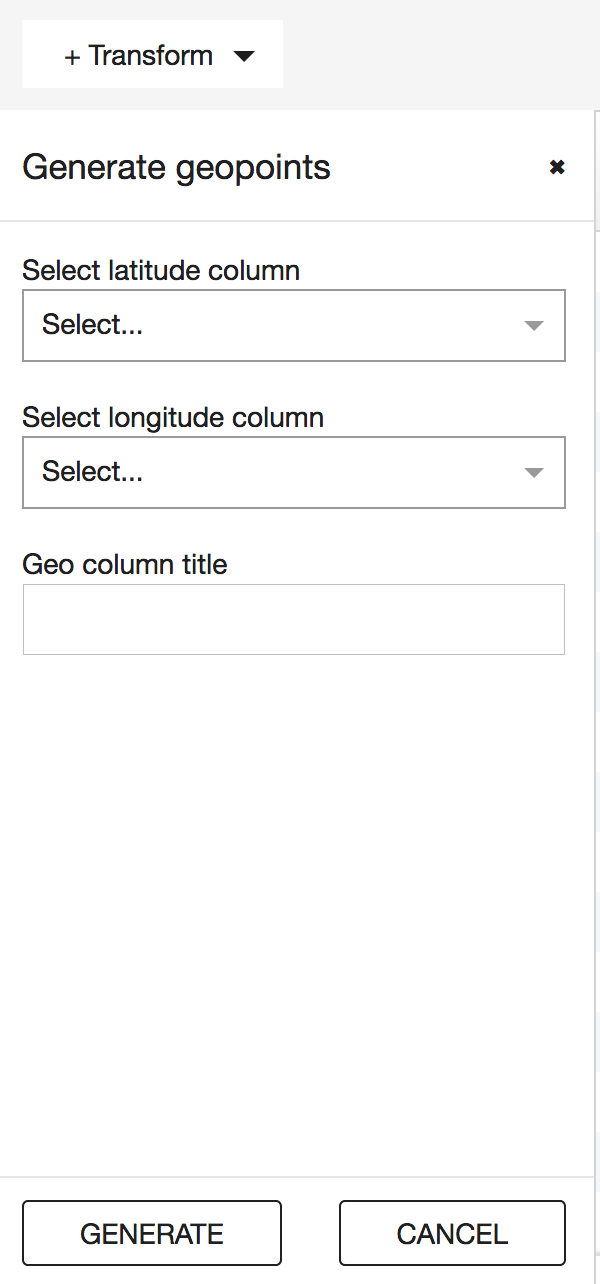
Generate geopoints (in a CSV dataset) to create a map
If a CSV dataset you're working with in Lumen contains latitude and longitude columns and you wish to use this dataset to generate a map, you would need to transform latitude and longitude to geopoints format first.
In datasets imported from Akvo Flow this is done automatically.
To generate geopoints in you CSV dataset, open the dataset in Lumen and click on the + Transform button in the top left corner of your screen. In the new side window choose the latitude and longitude columns you wish to transform and enter a name for the new column that will contain geo points.
You will find the new column with geo points at the very end of the dataset
Now everything is set to create a new map!
Reverse geocode
Reverse geocoding is a process of transforming geographical coordinates into a readable location name.
When do you need to do reverse geocoding on your data?
This transformation type is useful when you need to compare certain indicators across different locations or administrative units, but the only geo/location data you have available in your dataset is a geo point.
Before you do a reverse geocoding transformation, check if the following two conditions are met:
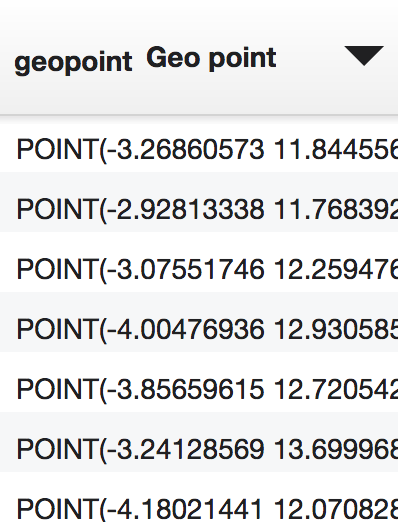
- The dataset you are working with contains a geo point column. It looks like this:
Your Lumen instance contains a shapefile* that has administrative units that you’d like to bring to your dataset as a location name Now let’s reverse geocode.
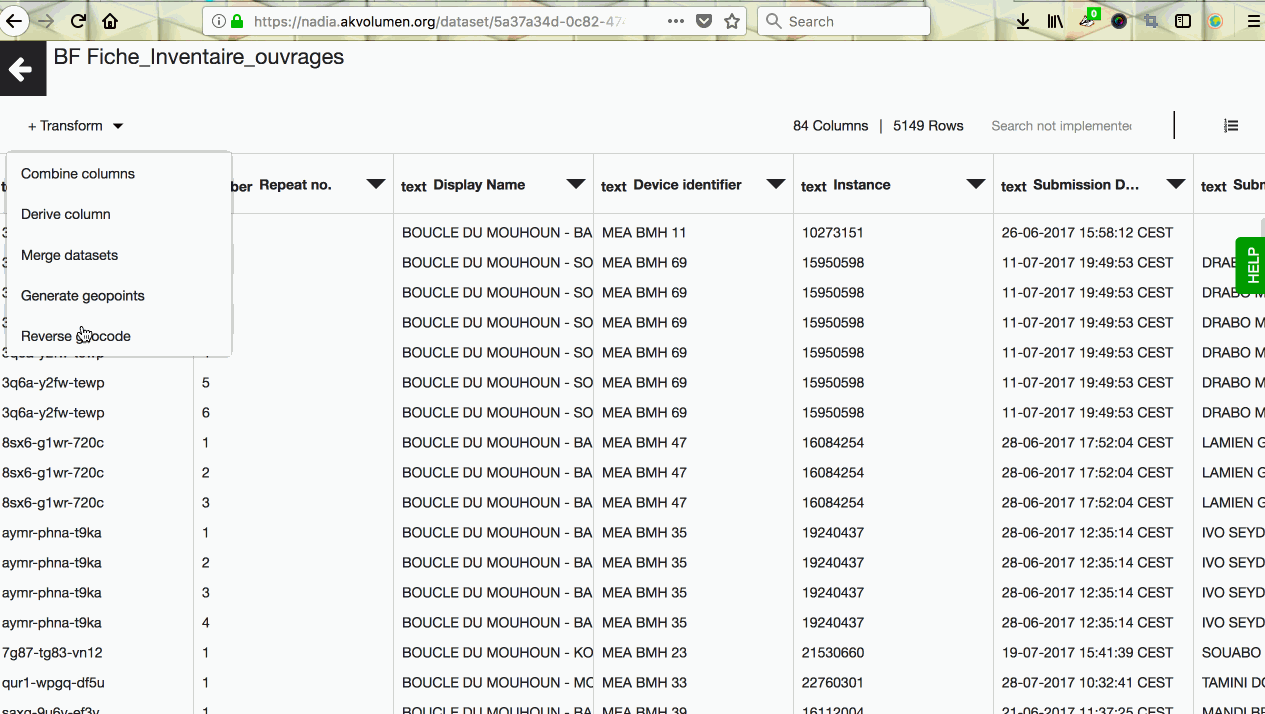
First, go to your dataset and click on the + Transform button in the top left corner. Choose ‘Reverse geocode’ from the dropdown menu.
A new screen will open up where you’ll need to set a few parameters for the transformation to happen.
On the left side of the screen you’ll see the name of the current dataset and its geo point column defaulted for you by the system. On the right side, you’ll see a set of fields related to a shape dataset you want to pull the name of the location from.
Once you select the shape dataset from the dropdown, a few other fields will open up for input. In the shape column, please pick the column containing a geoshape type data. For your convenience, the dropdown for this field will only show columns that contain geoshape data.
Next step would be to pick a column from a shape dataset that contains the location name you would like to get into your current dataset. Shape datasets can contain location data on different administrative levels. Check in advance which administrative levels are available in your shape dataset and which level you would like to work with. When this is sorted, go ahead and pick a corresponding value for ‘Text Column’ field.
The last step is to confirm the name of a new column that will contain the results of the reverse geocoding transformation. It will be defaulted for you based on the input in the previous field, but it’s possible to change the name by typing into the field.
When all the parameters are set, click on the ‘Apply’ button in the top right corner. If transformation goes ahead successfully, a new column containing location name will appear as the last column in your dataset.
The transformation will appear in the transformation log, which you can of course undo, if needed.
- Shapefile format - is a file format containing geospatial vector data, for instance, polygons that represent administrative boundaries of a village, county or country.