Share
Share your visualisation and dashboard
When you are in the visualisation or dashboard editor, you will notice a button in the top right of the page that says 'Share'. By clicking on this, Lumen will create a link to a webpage for your public facing visualisation or dashboard.
Any changes you make and save to your visualisation or dashboard, will automatically be updated to this page when you refresh. You can now open and share this link just as you would do with any other webpage.
Password protect your shared dashboard
With Lumen you can share a dashboard as any other webpage. Sometimes you need to protect the data you are sharing. To do so, you can add a password to your shared dashboard. Once opening the shared link, the viewer will have to type in the password to see the visualisations and insights on the dashboard.
Embed your visualisation and dashboard
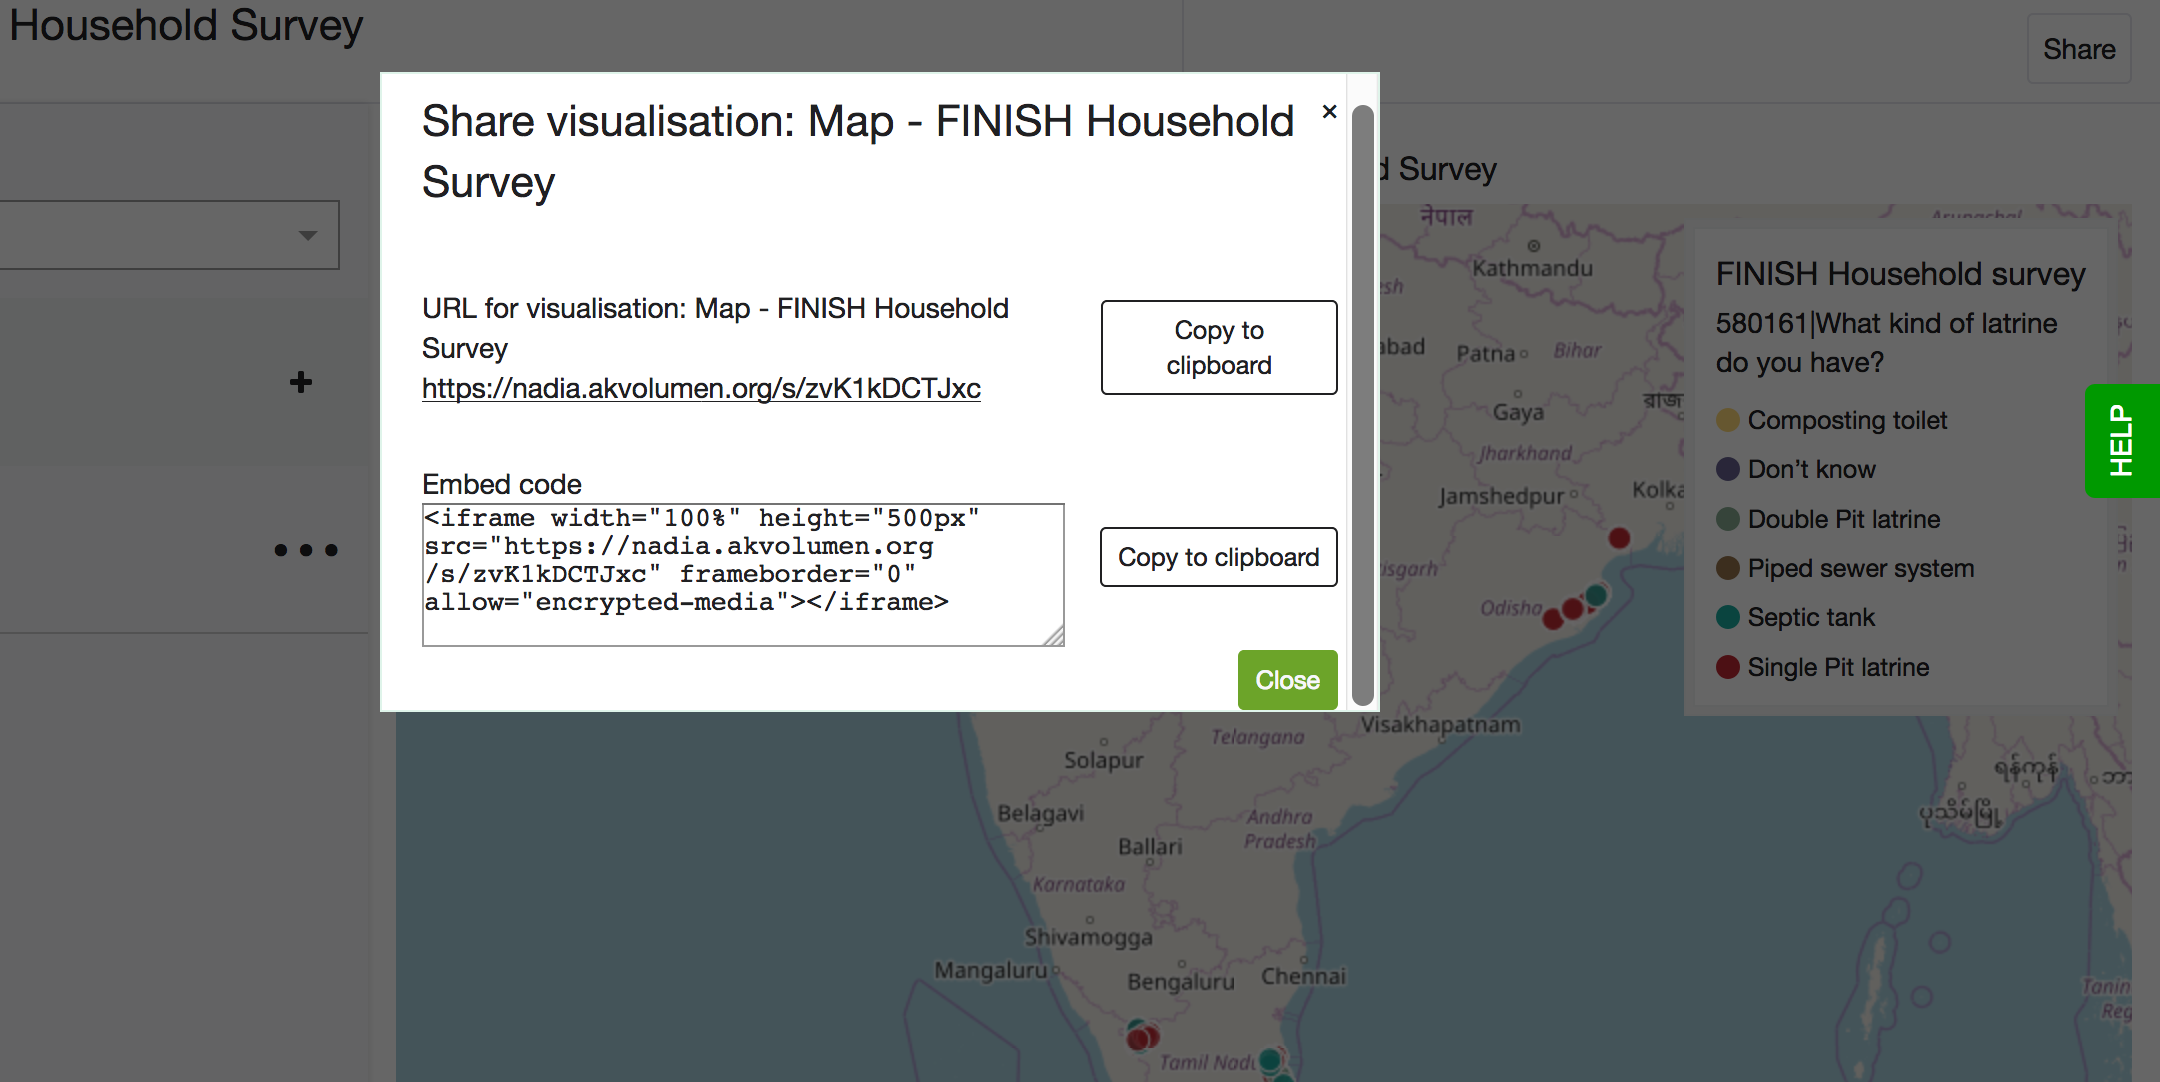
If you wish to incorporate a Lumen graph, map or entire dashboard in your web page, Lumen can provide you with an embed code.
Find the visualization you want to embed in your Lumen library. Click on it and once inside the visualization editor, click on ‘Share’ button located in the top right corner. A new window will pop with an option to ‘Get embed code’. Click on it and you’ll see a few lines of embed code, which you can then copy and use for your website.
Export your visualisation and dashboard
Lumen's data visualisations and dashboards are interactive and live. But sometimes you want to add that chart or the dashboard to your report, presentation or just print it out and put it on your wall. With the 'Export' option in your visualisation and dashboard editor you can export them as a .png or .pdf file.