Pivot Tables
Create a pivot table
To create a new visualisation, click on + Visualisation button that you'll see at the top of the screen. A choice of different visualisation types will open up, from which you should choose 'Pivot Table'.
You're now in the visualisations editor. Here you can pick a dataset using a dropdown in the field 'Source dataset'. The dropdown will show a list of datasets uploaded to your instance. If you wish to use a new dataset, you'll need to upload it first read how to upload a Flow dataset or a data file.
The moment you pick a dataset, you’ll get an immediate visual response in the form of the total number of data points in your dataset. Next, choose a dataset column that should go into columns of your pivot table. Each unique value from the selected column will become a column in your pivot table. If you choose a dataset column that contains more than 150 unique values, you’ll get an error, as we purposely limit the number of columns to display in a pivot table. In a similar way, pick data to populate rows in your pivot table.
Column and Row labels will be defaulted to the dataset column titles you’ve chosen, but feel free to customize it.
Aggregation method is similar to all the other visualization types available in Lumen – choose to aggregate your data on mean, median, max, min, count, count unique, sum, lower quartile and upper quartile.
Value display field is very useful as it allows you to choose whether your pivot table displays values as a percentage of row, a percentage of column or percentage of total. If you just want to see count, leave it on default.
By default Lumen shows row and column totals, but if you want to disable it, here’s where you can do it:
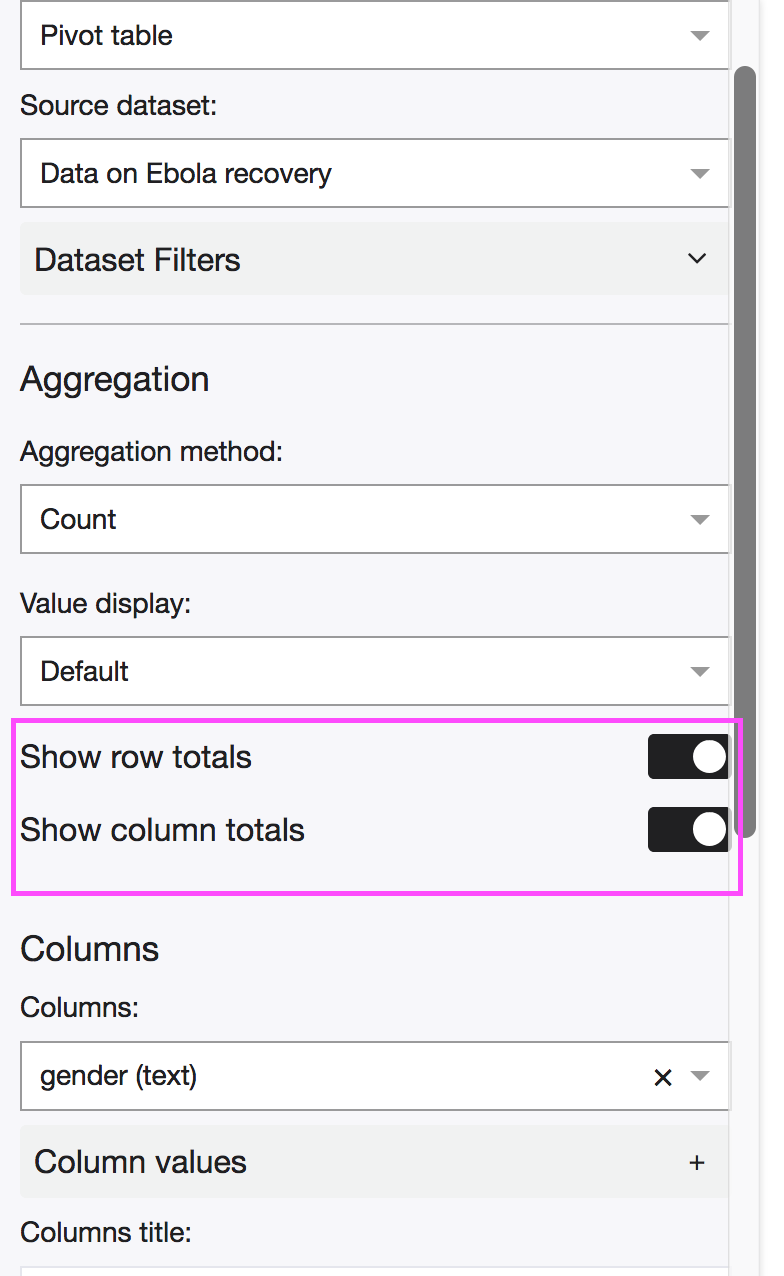
Use Dataset Filters when you want to filter out data from your visualisaiton. For instance, you could filter out all 'Other' survey responses, or choose to focus on data representing one gender only.
Lumen will auto-save all the changes you made.
Read more about different visualization types here.